- Market Overview
- Futures
- Options
- Custom Charts
- Spread Charts
- Market Heat Maps
- Historical Data
- Stocks
- Real-Time Markets
- Site Register
- Mobile Website
- Trading Calendar
- Futures 101
- Commodity Symbols
- Real-Time Quotes
- CME Resource Center
- Farmer's Almanac
- USDA Reports
How Is Jacobs Solutions’ Stock Performance Compared to Other Infrastructure Stocks?
/Jacobs%20Solutions%20Inc%20logo%20and%20website-by%20T_Schneider%20via%20Shutterstock.jpg)
With a market cap of $17.6 billion, Jacobs Solutions Inc. (J) is a global leader in providing professional services, including consulting, technical, scientific, and project delivery solutions. Headquartered in Dallas, Texas, Jacobs operates across various sectors, delivering end-to-end services in advanced manufacturing, cities and places, energy, environmental, life sciences, transportation, and water.
Companies worth $10 billion or more are generally described as “large-cap stocks,” and Jacobs Solutions perfectly fits that description, with its market cap exceeding this mark, underscoring its size, influence, and dominance within the engineering & construction industry. With its diverse service offerings and focus on innovation, the company is well-positioned to address the complex challenges of its clients globally.
J shares have fallen 1.8% from their 52-week high of $152.40, achieved on Aug. 13. Over the past three months, J stock has gained 17.5%, substantially outpacing the iShares U.S. Infrastructure ETF’s (IFRA) 8.9% rise over the same time frame.
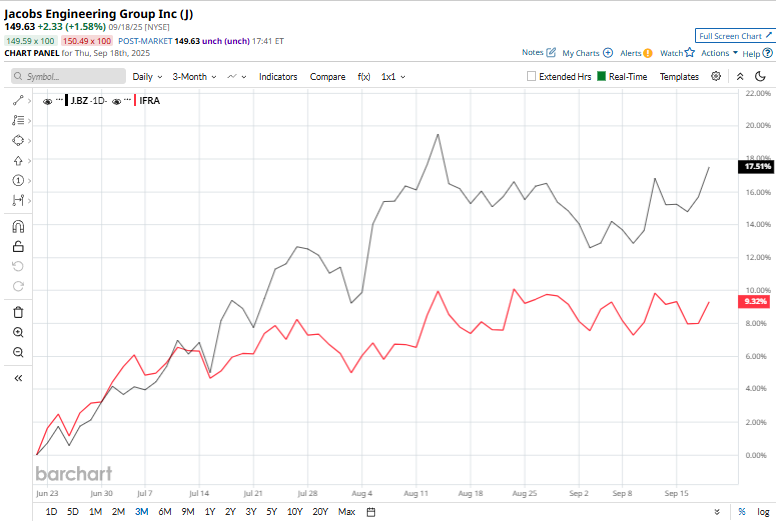
Shares of J have surged 12% on a YTD basis but climbed 23.4% over the past 52 weeks, compared to IFRA’s YTD gains of 12.5% and 12.9% returns over the last year.
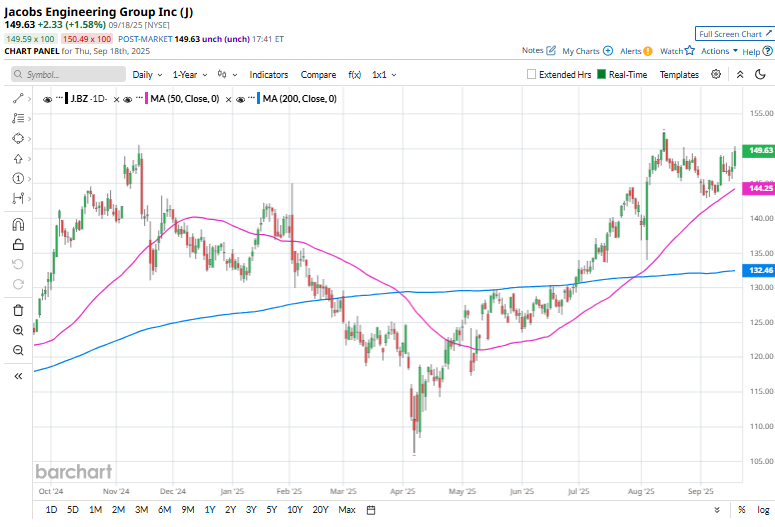
To confirm the bearish trend, J has been trading over its 50-day moving average since late April, and has remained above its 200-day moving average since early July.
On Aug. 5, Jacobs shares popped 3.8% after releasing its third-quarter earnings. Revenue jumped 5.1% year-over-year to $3 billion, comfortably beating analyst expectations of $2.2 billion. Its adjusted EPS surged 24.6% to $1.62, surpassing Wall Street estimates. The company also reported a 14% increase in its backlog, reaching a record high and highlighting robust forward demand.
Buoyed by these results, management raised its fiscal 2025 guidance for the second time, now anticipating adjusted net revenue growth of approximately 5.5% year over year and adjusted EPS in the range of $ 6.00 to $6.10.
Key rival, TopBuild Corp. (BLD), has taken the lead over J in 2025, showing resilience with a 34.5% return on a YTD basis. However, BLD shares lagged behind the stock with a 5.2% gain over the past 52 weeks.
Wall Street analysts are moderately bullish on J’s prospects. The stock has a consensus “Moderate Buy” rating from the 17 analysts covering it, and the mean price target of $157 suggests a potential upside of 4.9% from current price levels
On the date of publication, Kritika Sarmah did not have (either directly or indirectly) positions in any of the securities mentioned in this article. All information and data in this article is solely for informational purposes. For more information please view the Barchart Disclosure Policy here.